Water Level Is Always of Interest on the Island
The water level of Lake Huron changes significantly from year to year as well as from month to month. The minimum depth is typically in February and the maximum in July, with about an eleven inch change between the two. The highest July depth was in 1986 when the water was 2 feet 5 inches above the July average (which is 2 feet above the chart datum of 577.6 feet)and the lowest July depth was in 1964 when the water level was 2 feet 11 inches below the monthly average. Obviously a total swing of 5 feet 4 inches plays havoc with docks and shallow harbors. If that is not enough of a problem, storms can cause another 6 to 8 inches in variation at the island from the monthly averages.
In 2013 the seasonal low which was in January was about 0.1 inch below the seasonal low in 1964 but the water is coming up faster so the July low should not be a record.
The National Oceanographic and Atmospheric Administration, NOAA, has a lot of information on water level including a good chart showing the history. Their data is based on a chart datum which is 577.6 feet above sea level. The USGS has a publication, "Lake-Level Variability and Water Availability in the Great Lakes" with a lot of historical data.
The island originally had no harbor at all. There was not even any loose rock to speak of in the area that is now the harbor. The boats had to be pulled up on rollers. This harbor was made by extensive dynamiting after drilling holes deep into the rock. There was for many years an ongoing effort to make the resulting sea wall stronger, and deepening the harbor by removing rubble and large rocks from the bottom of the harbor.

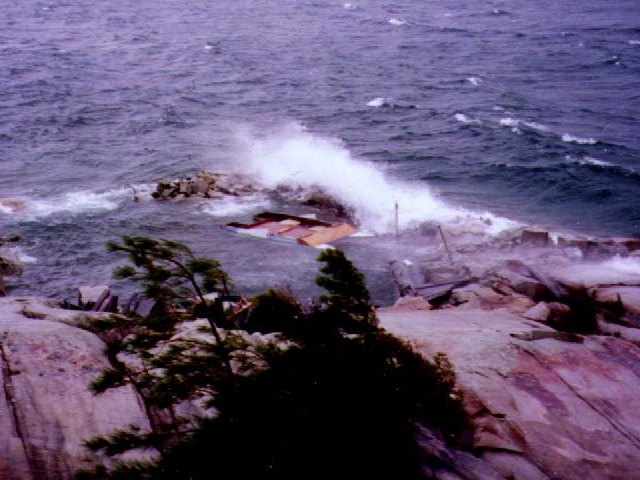
This picture was taken in 1985 a year before the record high water level.
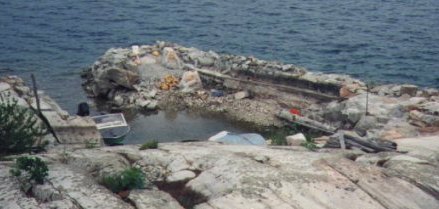
This picture of the harbor was taken in September 1993. The water level was only 7 inches above average July level -- before accounting for the storm serge.
The catamaran was submerged on purpose to protect it from the storm.
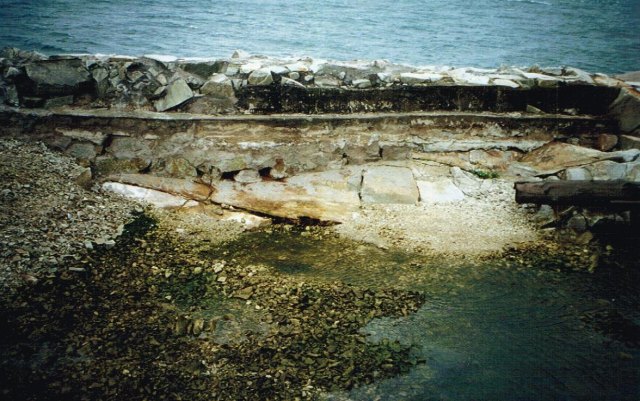
This is the water level in 2000. It was 1 foot 8 inches below the average July level.
These next two pictures were taken in September 22, 2001 when a storm lowered the water about 8 inches below the already low level of 2 feet below the average July level. Dave had gone up to close up for the year. He had to wait a number of days for the waters to return before he could get the boat off the rocks.
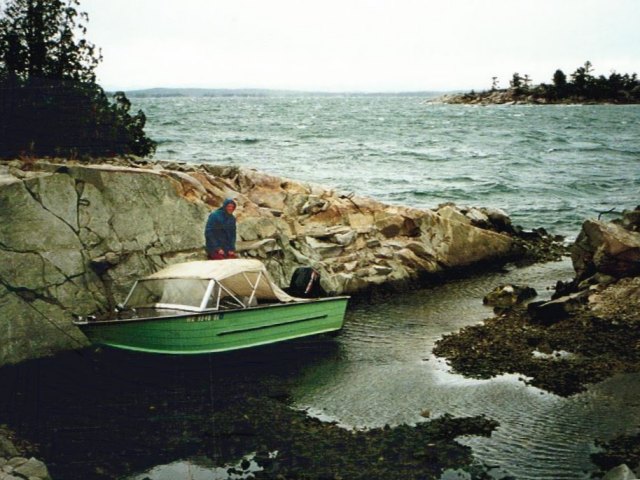
Dave Assessing the Situation
Information about possible ways to control the lake level better and a good historical view is available from http://www.lakelevels.org/
Rev 6/18/13