My DNA Results
I had
Ancestory.com test my DNA in May
2018 and April 2019 both dates look at the same DNA but the later one uses the
revised and expanded data base of results from mother people.
The quick summary is as follows:
The My Heritage results are based on the Ancestry test.
I did a Y-DNA test through
FamlyTreeDNA (On 5/27/20) to
trace my paternal ancestry and found out I am not a descendent of any
Frisinger at all but rather from William Bell 1685-1757 who immigrated to
Virginia from Northern Ireland. Either he or his parents were born in
Scotland.
This makes these results much more logical. Click
Here for more results of
that test.
Ancestry My
Heritage Ancestry
Ethnicity Estimate as of May
April Oct.
April Oct.
2018 2019 2019
2022 2022
Great Britain
10%
78%
England, Wales, Northwestern Europe 63% 69%
57%
Europe West
24%
0
Ireland/Scotland/Wales 32%
Ireland/Scotland
24% 13%
Scotland 11%
16%
Ireland
2%
Sweden & Denmark 23% 12%
15% 22%
European Jewish 0
1%
2%
Europe South 2%
0
Finland/Northern Russia <1%
0
5%
Norway
1% 2%
Eastern European
4%
Italian
1%
Jewish people in Europe
1%
Number of reference samples 3,000 16,000
68,000
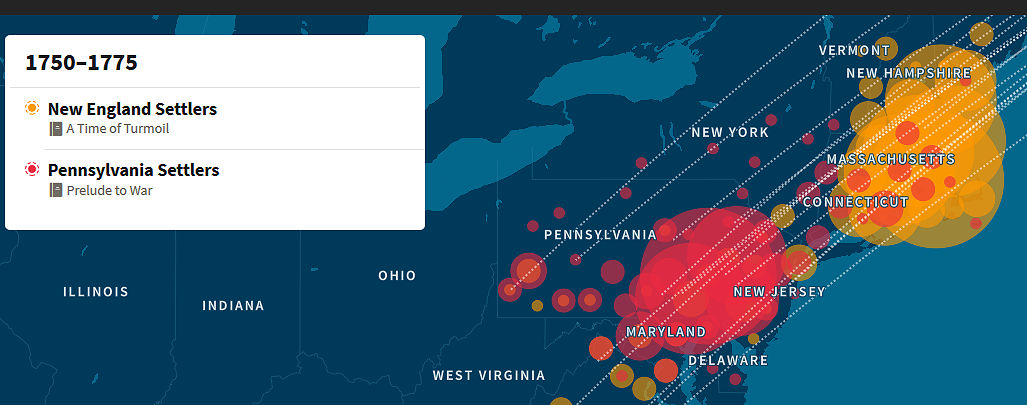
The April 2019 data also mentioned Additional Communities
New England Settlers: Massachusetts, Vermont & New Hampshire Settlers
Pennsylvania Settlers Pocono & North Jersey Settlers.
The categories have moved around so it is hard to pick out the changes but you can see that the results are broadly similar.
It is also interesting to note that 68% are from non-English speaking countries in the 2018 results. I wonder what the average is for Americans. My guess is most of us are less than 50% English Speaking.
I also had the same data analyzed by MyHeratage in 2019 and the results were similar.
This map is based on DNA day from Ancestry 2019 and shows where my ancestors were in 1750 to 1775. The New England ancestors were mostly from my mother's side and the Pennsylvania ones were my father's.
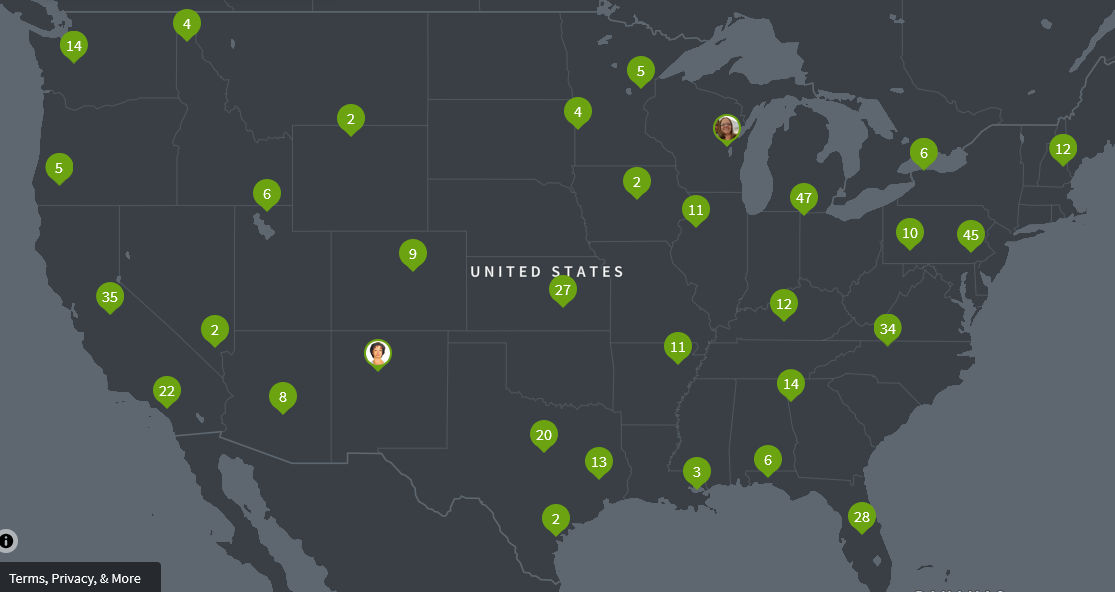
This is a map of the United States showing where 4th cousins or closer live in the United States based on DNA data in the Ancestry.com data base as of about Jan 1, 2022 There are also 5 in the UK, 4 in Hawaii, 3 in Australia and 1 in New Zealand, 1 in Alaska.
10/22/22